
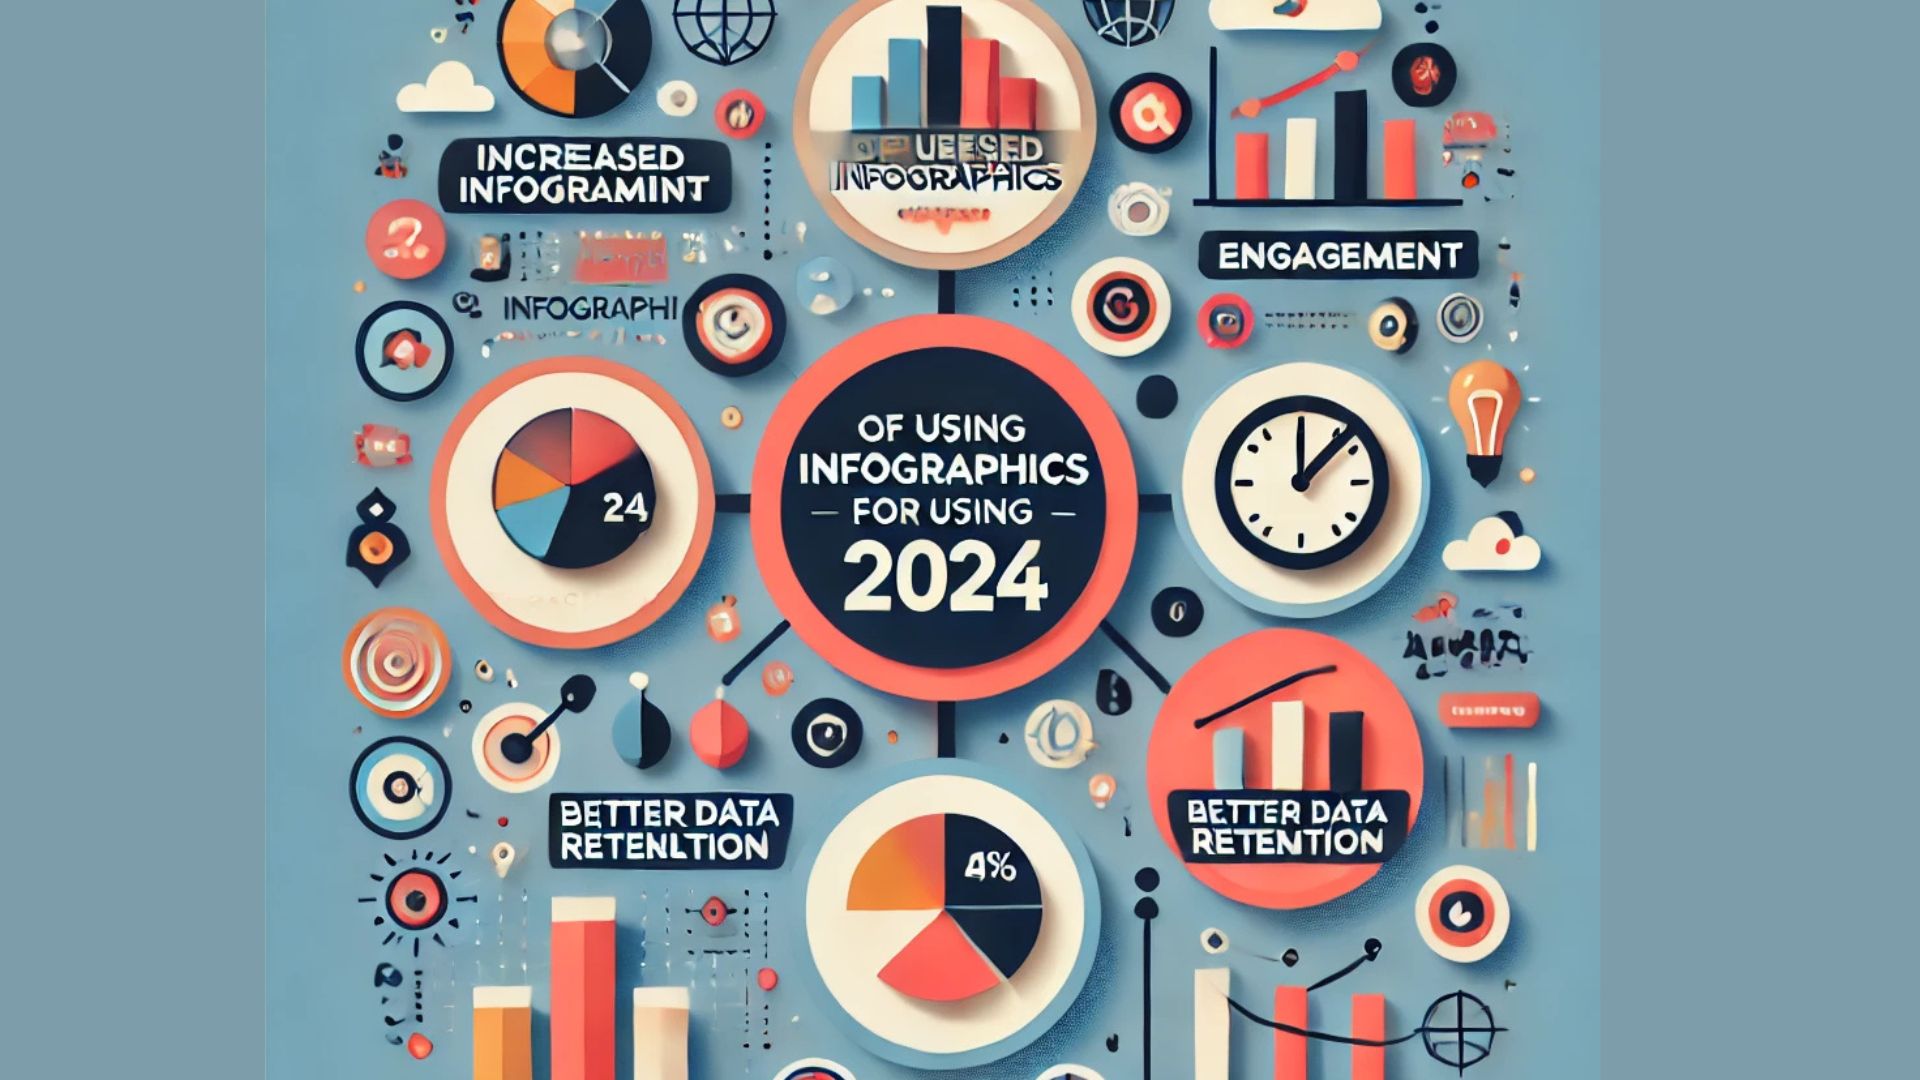
Have you ever tried explaining something complex to a friend, only to watch their eyes glaze over? That’s where infographics come in. A well-designed infographic breaks down information into bite-sized, visually appealing chunks. It makes data fun, stories engaging, and ideas easier to grasp.
In 2024, infographics are still a game-changer for content creators, marketers, and businesses.This also increases the click through rate. But here’s the catch—not all tools are made equal. Some are easy to use, while others require a designer’s touch.
Piktochart – Best for Data-Heavy Infographics
If Canva is like playing with LEGO, Piktochart is more like a well-organized toolbox. It’s fantastic for turning raw data into something visually striking.
Why Choose Piktochart?
Data Integration:
You can upload spreadsheets, and it automatically converts numbers into charts.
Customizable Templates:
More flexibility than Canva if you like tweaking details.
Great for Reports and Presentations:
Perfect for businesses that need clean, professional infographics.
I once had a client who needed a monthly report for his investors. He hated dull PowerPoint slides, so we switched to Piktochart. The difference? Investors read the report instead of skimming past endless numbers.
Canva – The Go-To for Beginners

When I first started creating infographics, Canva was a lifesaver. It’s the perfect tool if you have zero design experience but want professional graphics.
What Makes Canva Stand Out?
Drag-and-Drop Simplicity:
If you can move a mouse, you can use Canva.
Thousands of Templates:
There’s a template for a business report or a fun social media post.
Free and Paid Options:
The free version is solid, but the Pro version unlocks extra features.
I remember helping a friend with a school project. He was struggling to make his data look interesting. We jumped on Canva, picked a template, and within 15 minutes, his boring numbers turned into an eye-catching infographic. The professor was impressed, and he got an A. Not bad for a free tool!
Venngage – Best for Teams and Collaboration
Venngage is the tool you need when multiple people work on the same infographic. If you’re part of a marketing team or handling client projects, this one’s a solid pick.
Why Venngage?
Team Collaboration:
Multiple users can edit in real-time.
Brand Kit Feature:
Keeps designs consistent with your brand.
Lots of Icon Choices:
Icons and illustrations make your infographic pop.
I once worked on an event presentation where three team members had different ideas. Instead of emailing edits back and forth, we used Venngage to update everything live. It saved us hours of frustration.
Visme – Best for Interactive Infographics
Want to create infographics that do more than sit on a page? Visme lets you add animations, videos, and clickable elements.
Why Visme?
Interactive Features:
Make your designs more engaging with animations.
Presentation Mode:
Turn infographics into slideshows.
Data Visualization Tools:
Great for marketers and educators.
I once created an interactive infographic for a product launch. Instead of a boring PDF, we made a clickable design where users could explore different product features. The result? More engagement and higher sales.
Adobe Express – Best for Stunning Visuals
Adobe Express is a fantastic alternative if you love Adobe products but find Photoshop too complex.
Why Adobe Express?
Professional-Quality Graphics:
More refined than free tools.
Easy-to-Use Interface:
No design degree is needed.
Integration with Adobe Suite:
Works seamlessly with Photoshop and Illustrator.
A friend of mine, who runs an Etsy store, used Adobe Express to create product infographics. His sales shot up after adding sleek, informative visuals to his listings. The lesson? Good design sells.
Snappa – Best for Quick Designs
If you need an infographic fast, Snappa is a great option. It’s lightweight, easy to use, and perfect for quick social media graphics.
Why Snappa?
Super Fast Design Process:
Create infographics in minutes.
Great for Social Media:
Optimized for platforms like Instagram and Pinterest.
Simple Yet Effective:
No complex features to slow you down.
A content creator I know swears by Snappa. She runs multiple social media accounts and needs quick, engaging graphics daily. Snappa helps her stay consistent without wasting hours on design.
Infographics are more than just pretty pictures. They simplify information, make content more engaging, and boost audience retention. Whether a beginner or a pro, a tool exists to match your needs.
Key Features to Look for in an Infographic Tool
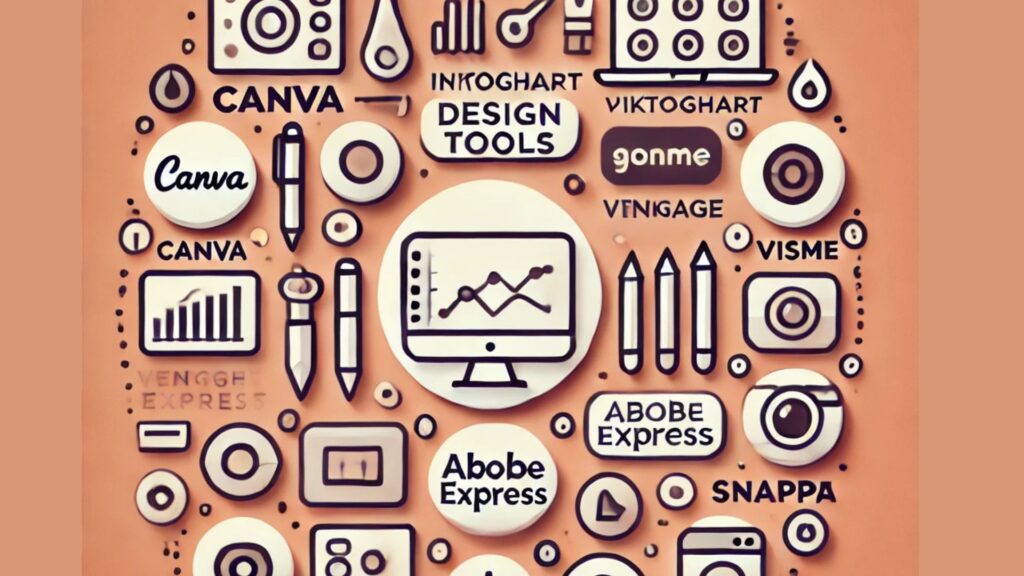
Not all infographic tools are created equal. When choosing the right one, consider features like ease of use, customization options, collaboration capabilities, and the ability to handle data visualization. The right tool should match your skill level and purpose, whether it’s for social media, business reports, or educational conte
FAQS
1. What is the easiest tool for beginners to design infographics?
Canva is the best option for beginners due to its user-friendly drag-and-drop interface and ready-made templates.
2. Which infographic tool is best for data visualization?
Piktochart is ideal for turning raw data into visually appealing charts and reports.
3. Can I create interactive infographics?
Yes, Visme allows you to add animations, videos, and clickable elements to make your infographic interactive.
4. What tool is best for team collaboration?
Venngage offers real-time collaboration features, making it perfect for teams working together on infographics.
5. Is there a free tool for creating high-quality infographics?
Canva, Piktochart, and Snappa offer free versions with a variety of templates and features.


