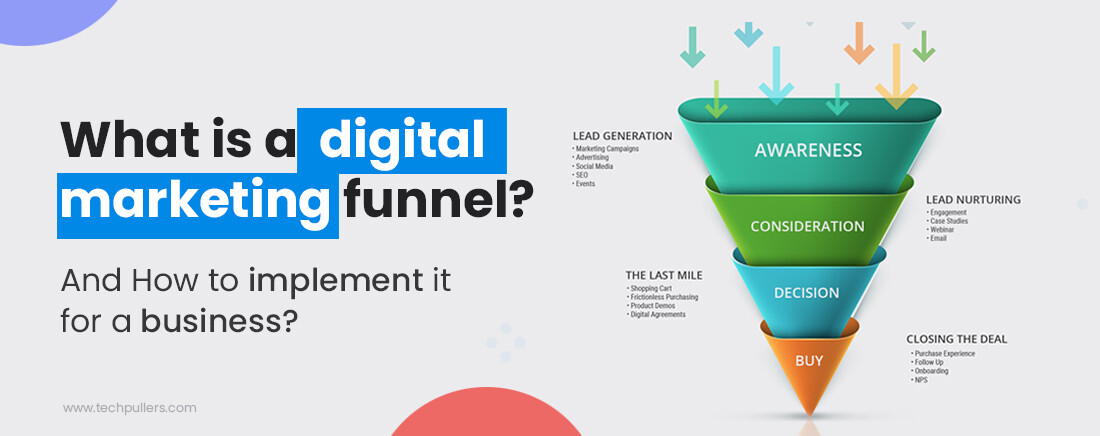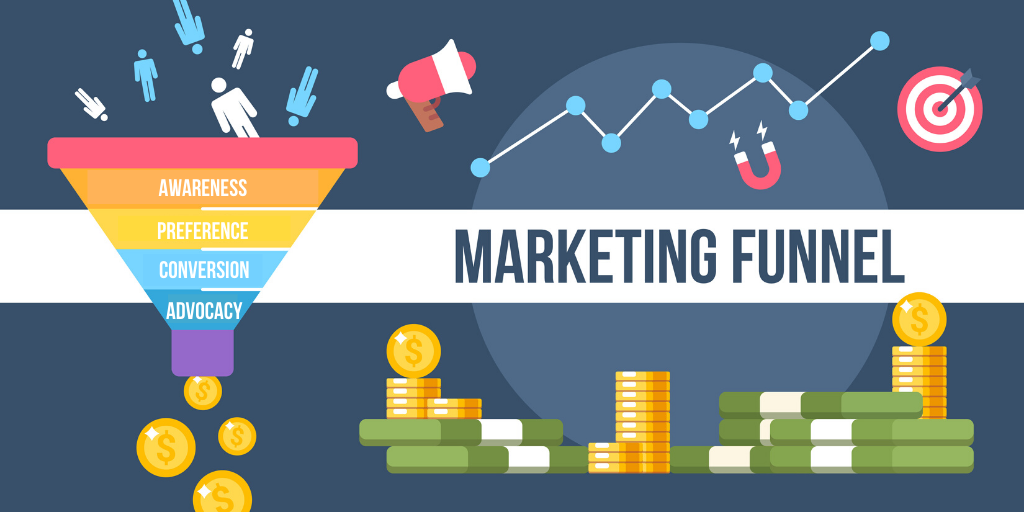

Funnel marketing is a powerful framework that visualizes the customer journey, from initial awareness to final purchase, and often even beyond to repeat business and advocacy. Analyzing key metrics at each stage of the funnel can reveal where prospects drop off, which strategies are most effective, and how to maximize conversion rates. In this article, we’ll break down the key metrics for each stage in the funnel—awareness, consideration, conversion, and retention—offering insights into how to leverage data for improved outcomes.
1. Understanding Funnel Marketing: Why Key Metrics Matter
Funnel marketing describes the step-by-step process through which prospects become customers. Traditionally, this journey includes stages like awareness, consideration, and conversion. However, as customer expectations and digital marketing evolve, many funnels now also include post-conversion stages such as retention and advocacy.
Each stage of the funnel can provide valuable data that, if analyzed correctly, allows you to optimize your marketing efforts to reduce friction, maximize conversions, and improve the customer experience. Key metrics for each stage serve as signposts, guiding marketers on where to focus efforts to achieve maximum impact.
2. Top Funnel Metrics: Awareness Stage
The awareness stage is the top of the funnel (TOFU), where potential customers first learn about your brand. The goal is to capture attention, build brand recognition, and encourage prospects to move into the consideration stage.
Key Metrics for Awareness Stage
- Impressions: This metric tells you how often your content (e.g., ad, social post, blog) is displayed to users. It’s a primary indicator of reach and brand exposure.
- Unique Reach: Unique reach is the number of distinct individuals exposed to your content. If one user sees your ad multiple times, they only count once toward unique reach. High unique reach suggests that your message is being seen by a broad audience.
- Traffic Source: Tracking the source of your traffic—whether organic, paid, social media, or referral—helps you understand which channels drive the most awareness. You can then optimize these channels to broaden your reach.
- Click-Through Rate (CTR): CTR is the percentage of people who click on a link after viewing it. A high CTR indicates that your ad copy, images, or headlines are resonating with the audience, whereas a low CTR may indicate a need for refinement.
- Cost per Thousand Impressions (CPM): CPM is a paid advertising metric that tells you the cost of 1,000 ad impressions. Monitoring CPM helps you assess the efficiency of your ad spend at the awareness stage, allowing you to adjust your budget or platform choices.
3. Middle Funnel Metrics: Consideration Stage
Once a prospect is aware of your brand, they enter the consideration stage, where they evaluate your product or service in comparison to competitors. The goal here is to provide valuable information and build trust.
Key Metrics for Consideration Stage
- Engagement Rate: This metric measures user interactions like comments, likes, shares, or time spent on content. High engagement often indicates that prospects find your content valuable, moving them closer to making a purchase decision.
- Bounce Rate: Bounce rate is the percentage of visitors who leave your website after viewing just one page. A high bounce rate could indicate that your content isn’t engaging or that there’s a mismatch between your audience’s expectations and the actual content.
- Pages per Session: This measures how many pages a user visits during a single session. A higher pages-per-session rate usually signifies a stronger interest in your content, suggesting prospects are exploring more about your brand or offerings.
- Lead Capture Rate: This metric is critical if you have lead generation forms, like newsletter sign-ups or gated content. Lead capture rate is the percentage of visitors who provide their contact information in exchange for additional content. It’s an important indicator of engagement and interest at the consideration stage.
- Cost per Lead (CPL): CPL calculates the cost of acquiring a new lead. Understanding CPL helps you evaluate how efficiently your marketing spend generates leads and assists in budget optimization for maximum ROI.
4. Bottom Funnel Metrics: Conversion Stage
The conversion stage is the bottom of the funnel (BOFU), where prospects take the final step to become customers. Metrics at this stage assess the effectiveness of sales strategies, checkout processes, and conversion paths.
Key Metrics for Conversion Stage
- Conversion Rate: The conversion rate is the percentage of leads or website visitors who complete a desired action, such as making a purchase or signing up for a subscription. This is one of the most important metrics to monitor, as even small changes can significantly impact revenue.
- Cost per Acquisition (CPA): CPA measures the average cost to acquire a new customer. A lower CPA indicates a more efficient funnel, and tracking CPA helps in budgeting for future campaigns.
- Shopping Cart Abandonment Rate: For e-commerce businesses, cart abandonment rate is a crucial metric. A high rate suggests friction in the purchase process, whether due to hidden fees, a complex checkout process, or a lack of payment options.
- Sales Cycle Length: This metric tracks the average time it takes for a prospect to move from awareness to conversion. A shorter sales cycle can indicate a more effective funnel and high-quality leads. Monitoring this helps identify areas in the funnel where prospects may be slowing down.
- Average Order Value (AOV): AOV is the average amount spent per transaction and is valuable for understanding buying behavior. A higher AOV often correlates with better targeting or optimized upselling strategies.
- Revenue per Visitor (RPV): RPV calculates the revenue generated from each visitor. This metric provides insight into the overall profitability of your funnel and helps prioritize the most lucrative traffic sources.
5. Post-Conversion Metrics: Retention and Advocacy
Retaining customers and encouraging them to advocate for your brand are important for building long-term value. Monitoring retention and advocacy metrics helps assess customer loyalty and satisfaction.
Key Metrics for Retention and Advocacy
- Customer Retention Rate (CRR): CRR measures the percentage of customers who return to make additional purchases. High retention indicates customer satisfaction and brand loyalty.
- Customer Lifetime Value (CLTV): CLTV estimates the total revenue you can expect from a customer over their lifetime. This metric helps you understand the long-term value of customers acquired through your funnel, which can guide budget allocation.
- Net Promoter Score (NPS): NPS measures customer satisfaction and the likelihood that a customer will recommend your product or service. High NPS indicates strong brand advocacy, which can lead to organic growth and lower customer acquisition costs.
- Repeat Purchase Rate: This metric tracks the percentage of customers who make more than one purchase. A high repeat purchase rate signifies a loyal customer base and suggests that your post-purchase engagement is effective.
- Churn Rate: Churn rate is the percentage of customers who stop using your product or service. A high churn rate could indicate a need for improvements in customer experience, product quality, or support.
6. Optimizing the Funnel: Data-Driven Strategies for Success
Collecting data at each funnel stage allows you to make informed adjustments. Here are a few strategies for leveraging these metrics:
- A/B Testing for Conversion Optimization: Conduct A/B testing on landing pages, calls to action (CTAs), and product pages to increase conversion rates.
- Content Personalization: Use data from the consideration stage to personalize content and recommendations based on user behavior.
- Targeted Retargeting Ads: Retarget users who abandon the funnel with ads customized to their specific stage.
- Enhanced Email Marketing: Use email to re-engage leads from the consideration stage or incentivize purchases from the conversion stage.
- Continuous Performance Review: Regularly review funnel metrics to identify drop-off points, adjust strategies, and test new approaches for improved results.
Conclusion
Analyzing key metrics throughout each stage of the funnel provides a clear picture of the customer journey and helps identify opportunities for optimization. By understanding what each metric tells you about customer behavior, you can make data-driven decisions that reduce drop-offs, improve conversion rates, and enhance retention. Whether at the awareness stage or nurturing repeat customers, a well-optimized funnel fueled by accurate data is key to scaling your business and driving long-term growth.


