
Crypto trading can be exciting, rewarding, and sometimes overwhelming—especially when you’re starting out. Among the many concepts you’ll come across, “resistance” and “support” stand out as essential tools for building a solid trading strategy. If these terms sound intimidating, don’t worry! By the end of this article, you’ll feel confident about incorporating them into your trading decisions. Let’s dive in.
What Are Resistance and Support?
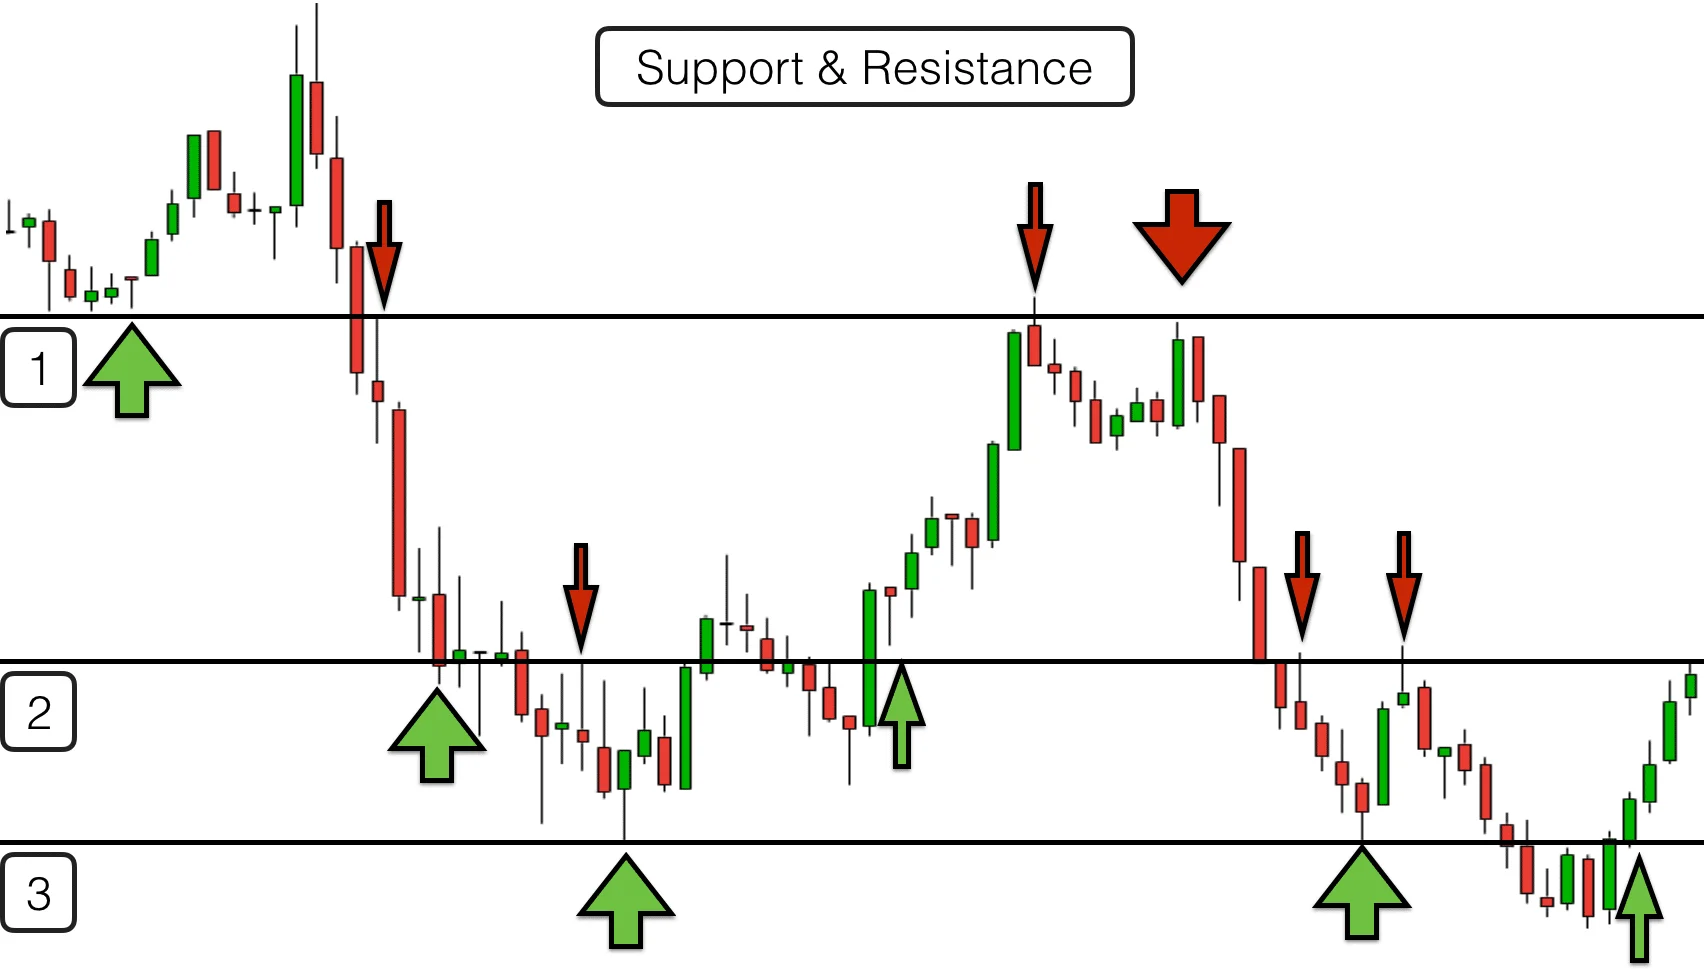
When you look at a crypto price chart, you’ll notice that prices don’t move in a straight line. They fluctuate, forming patterns. Resistance and support are critical levels in these patterns, representing the psychology of market participants.
Resistance
Resistance is like a ceiling that prices struggle to break through. When the price reaches this level, many traders feel it’s overvalued and begin selling, which increases supply and pushes the price downward.
Example: Imagine Bitcoin is trading at $29,000, and every time it nears $30,000, sellers emerge, driving the price back down. In this case, $30,000 becomes a resistance level. This is often observed in trading pairs like BTCUSDT, where resistance and support levels play a significant role in determining market entry and exit points.
Support
Support, on the other hand, is like a floor that prevents prices from falling further. When the price hits this level, buyers step in, seeing it as a good deal, which increases demand and pushes the price back up.
Example: If Ethereum keeps bouncing back up after touching $1,500, this price level acts as a support zone.
Understanding these levels can help you predict how prices might behave in the future and develop smarter strategies.
Why Are Resistance and Support Important?
Mastering resistance and support can transform your trading. Here’s why these levels are crucial:
Identifying Entry and Exit Points
Resistance and support help you pinpoint the best times to enter or exit a trade. Buying near support minimizes risk, while selling near resistance locks in profits before prices reverse.
Risk Management
Setting stop-loss orders near support or resistance protects your trades from major losses. For instance, if you buy Bitcoin at $28,000 with a support level at $27,500, placing a stop-loss slightly below $27,500 reduces your downside.
Adapting to Market Conditions
Whether the market is bullish (uptrend), bearish (downtrend), or sideways (range-bound), these levels remain relevant, giving you an edge regardless of the conditions.
How to Identify Resistance and Support Levels
Finding resistance and support levels might seem tricky at first, but with practice and the right tools, it becomes second nature. Here are the best methods to identify these levels:
1. Historical Price Data
Check past price movements to spot levels where prices repeatedly reversed. For instance, if Bitcoin consistently bounced back from $20,000 in the past, this level is likely a strong support.
2. Technical Indicators
Use indicators to confirm what you see on the chart:
- Moving Averages: A moving average acts as dynamic support or resistance. In an uptrend, prices often bounce off the moving average line.
- Fibonacci Retracement: This tool highlights potential support and resistance based on historical price patterns. Key levels like 61.8% or 38.2% often align with market reversals.
- Bollinger Bands: These bands help identify volatility and potential reversal zones.
3. Round Numbers
Round figures like $10,000, $20,000, or $50,000 often act as psychological barriers. Traders tend to place buy or sell orders at these levels, creating resistance or support.
4. Volume Analysis
High trading volume near a price level strengthens its validity as resistance or support. For instance, if Ethereum repeatedly sees a surge in buying at $1,800, this level is likely a strong support.
Common Mistakes When Using Resistance and Support
Even seasoned traders make mistakes when using resistance and support. Avoid these pitfalls to stay ahead:
Over-Relying on a Single Method
Relying only on historical data or one indicator can lead to missed opportunities or false signals. Always use multiple tools to confirm your analysis.
Ignoring Market Conditions
A resistance level in a bearish market might break easily in a bullish rally. Stay aware of the overall trend when analyzing levels.
Misinterpreting Breakouts and False Signals
Not all breakouts (when the price crosses resistance) are genuine. Some are “fakeouts,” where the price briefly breaks a level before reversing. Use confirmation signals, like increased volume, before acting on breakouts.
Strategies for Trading with Resistance and Support
Once you’ve identified resistance and support, it’s time to put them to use. Here are three common strategies:
1. Breakout Trading
Breakout trading involves entering a trade when the price breaks through resistance or support.
- Tip: Wait for confirmation, like a price closing above the resistance level, to avoid fakeouts.
2. Range-Bound Trading
When the market moves sideways, prices tend to bounce between resistance and support.
- Strategy: Buy near support and sell near resistance repeatedly during these conditions.
3. Stop-Loss and Take-Profit Placement
Place stop-loss orders slightly below support (for long positions) or above resistance (for short positions). Similarly, set take-profit orders near resistance or support levels to lock in gains.
Using Tools and Resources to Master Resistance and Support
To truly master resistance and support, leverage modern trading tools. Here are some beginner-friendly platforms:
- TradingView: A powerful charting platform with built-in tools for drawing resistance and support.
- Crypto Exchanges: Many exchanges, like Binance and KuCoin, offer basic charting features for identifying levels.
- Educational Resources: Consider online courses or tutorials on technical analysis to deepen your understanding.
Case Studies and Examples
Let’s see how resistance and support work in real-life scenarios:
Example 1: Bitcoin Breakout Bitcoin struggles to break past $50,000 for weeks, making this a resistance level. One day, it breaks above $50,000 with high volume. A savvy trader enters the trade, riding the bullish wave to $55,000.
Example 2: Ethereum Support Bounce Ethereum drops to $1,800 multiple times but never goes lower. A trader buys near this support and sets a stop-loss at $1,750. As prices rise to $2,000, they secure a tidy profit.
Conclusion
Understanding resistance and support is a game-changer for crypto trading. These levels help you time your trades, manage risks, and adapt to market trends. Start by identifying these levels on simple charts, experiment with different strategies, and practice on demo accounts before going live.
Remember, the key to mastering resistance and support is consistency and patience. Happy trading, and may your profits always break resistance!


